
Improving Pedalling efficiency Part 1: Diagnosis and Imbalances
Tracking your pedalling metrics will help you identify what to work on to increase your pedalling efficiency.
May 6th 2020, By Richard Rollinson
Improving how economical you are in your pedal stroke can lead to very significant gains in greater power used to propel your bike forward faster and waste less energy. In this blog you will discover how to go about improving this.
Tracking
In order to improve, it always helps to have a way of measuring to begin with in order to find solutions. There is a time and a place to look at pedalling metrics and that is not so much during a ride as it is often not practical to identify what you need to work on and put that into action within the same ride, unless this is a ride where a bike fit is being performed.
With an uploaded power file, there is the ability with certain power meters and motion sensors such as Leomo, to either diagnose pedalling inefficiencies or identify what is working well.
What metrics do we have available to track pedalling characteristics? With dual sided power meters that record Torque effectiveness and pedal smoothness, we are able to see these in WKO5:
- Gross Power Released: A measure of your effective power output that is only used to contribute to the speed of your bike. This can be seen for total power and for left and right legs individually.
- Gross Power Absorbed: A measure of your non effective power that you have produced but is not being used to contribute to the speed of your bike. This can be seen for total power and for left and right legs individually.
- Power Balance: Ratio of total power between left and right legs.
- Kurtotic Index: Measures the evenness of force distribution through the peak power phase of a pedal stroke only. Taking the maximum point of force and showing how close or far away the other points of force were to the maximum.
- Torque v Crank speed: Showing these 2 metrics plotted on a scatter graph can show how well a rider is using pedalling acceleration or force with the most effective cadence or gear selection.
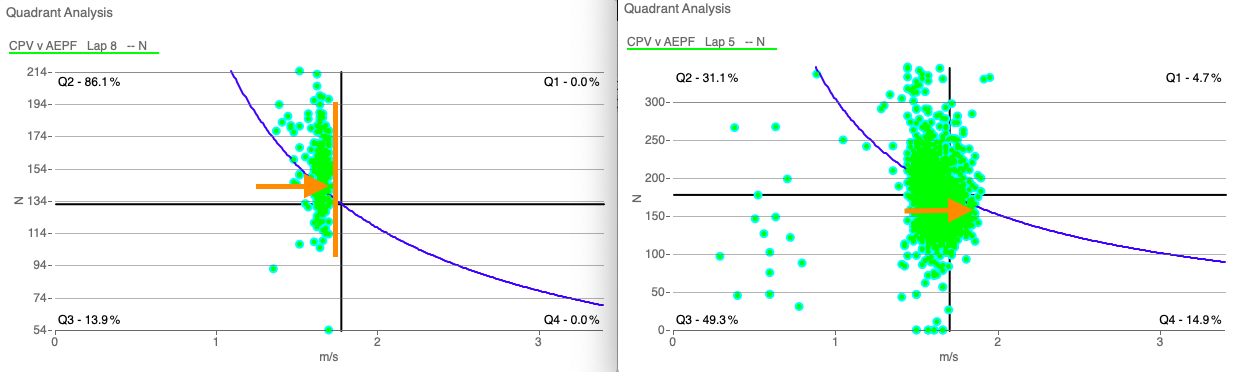
A "Quadrant Analysis" chart showing torque and crank speed. The left scatter plot showing an interval where power is increased through torque and harder gear selection. The right scatter showing optimal acceleration in power through both cadence and torque increase
With Garmin Vector Cycling Dynamics, we are able to see these metrics separately from left and right legs in WKO5:
- Peak power phase length in total degrees.
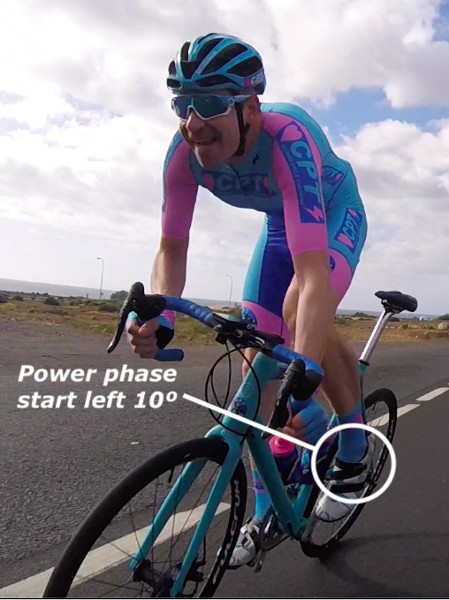
- At which degrees in the pedal stroke the peak power phase started and ended.
- What the length of the peak power phase was.
- How far to the inside or the outside of the pedal you put in the most force, known as Platform Centre Offset (PCO).
With Leomo Motion performance sensors, we can see these metrics separately from left and right legs:
- Angle of your foot through the entire pedal stroke.
- Angle of your foot through the top quarter of the pedal stroke.
- The range of degrees that your upper leg moves by.
And these metrics from your core:
- How much the pelvis rocks side to side.
- How much the pelvis rotates.
- Your torso rock from side to side.
- The angle of your torso.
If all of that data is available, that is quite a lot of metrics to choose from and get bombarded with. In order for the data to be useful, we need to go back to what you want to achieve from looking at pedalling metrics. This should start from a scenario. Let’s go through some possible imbalnce scenarios.
Diagnosing imbalances
You have the feeling that you might have a left right power or pedalling imbalance, this may be caused through past injuries. It could be from technique that would benefit from improvement, or strength differences in different leg muscle groups.
A leg injury, or indeed an upper body injury, even deep in the past can cause an imbalance by changing your pelvic angle. The Leomo metrics are great for identifying this and the Garmin and WKO5 metrics can help to confirm diagnosis. This can prompt a correction in bike fitting, or correction in your body from physio sessions or strength exercises. One example being if you have an adjacent upper body injury that tilts one side of your pelvis lower, this can impact your balance of power and pedalling metrics that can also be diagnosed with Leomo Pelvic motion indicators.
Your Imbalances could impact on your pedalling technique, or your pedalling technique could be impacting on causing imbalances. A poor bike fit can easily influence imbalances too. For example, if your cleats are not set up in natural alignment of your foot on one side, you could favour the opposing leg.
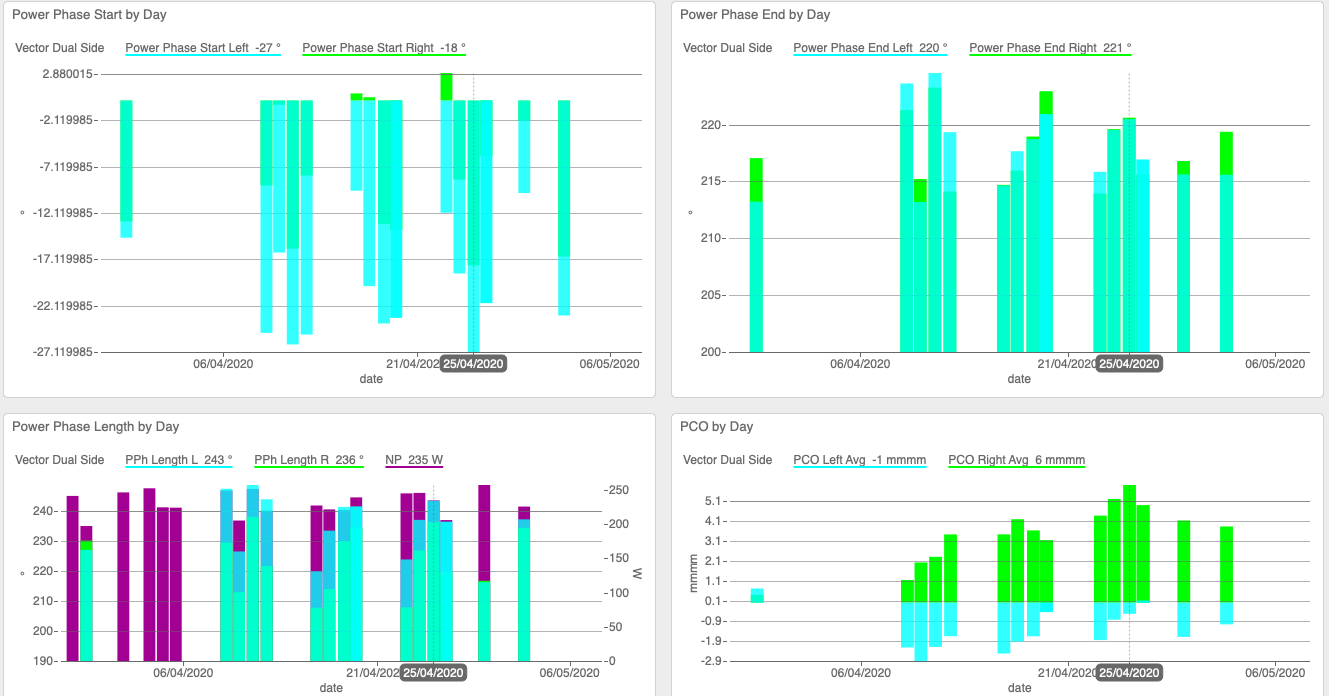
A summary dashboard from completed rides with Garmin Cycling Dynamics. Differences in left right power phase start point is just one metric that can help identify technique or strength differences in legs and muscle groups.
Perfect 50/50 power balance is rare and most riders tend to be stronger in one leg and use the other leg to control the action of the pedal stroke, like one leg is the brains and the other is the brawn. With a stable balance, muscle groups are more even in strength and technique will more likely be more effective.
When looking at Kurtotic Index, a significantly higher score on one side compared to the opposing leg may identify less even control through each peak power phase. Looking at the angle of your foot in the first quarter of your pedal stroke, combined with the angle of the start of your peak power phase can show if you are slightly heel down at top dead centre. This can be a sign of a weaker calf on one side and stronger upper leg muscles on the same leg.
When diagnosing effective or ineffective pedalling technique, always start with what may be seen as a potential problem or what you believe is a good technique that you want to be confirmed by the metrics so you can be confident in knowing you are efficient. Pedalling metrics help to steer you to a plan of action to improve technique or bike fit to improve your economy in your pedal stroke.
Related Blogs
Improve Your Pedalling Efficiency Part 2: Exercise and Bike Fit Solutions to Imbalances


What is CPT Cycling?
Custom training plans with a 360º approach to your unique physiology and goals with actionable feedback to help you become a faster cyclist, explained simply with a personal touch from an expert cycling coach.